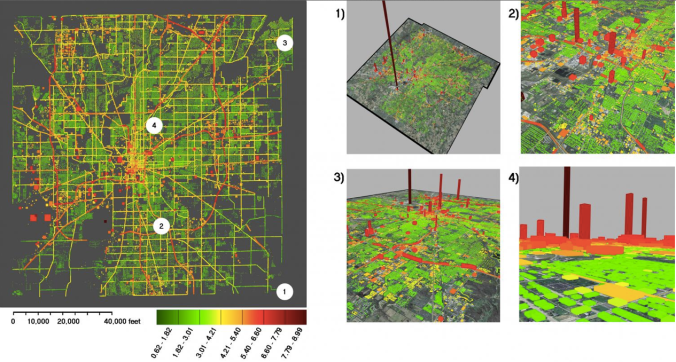
With Hestia, researchers from Arizona State University have a detailed understanding of where CO2 is being emitted from the urban landscape. This map shows where CO2 is emitted across the city of Indianapolis, Indiana, and combines data from sources including factories, automobiles on roadways, homes, and power plants. Credit: Bedrich Benes and Michel Abdul-Massih
Click the image above to read more about this at Phys.org:
Dubbed “Hestia” after the Greek goddess of the hearth and home, researchers presented the new system in an article published October 9 in Environmental Science and Technology. Hestia combines extensive public database “data-mining” with traffic simulation and building-by-building energy-consumption modeling. Its high-resolution maps clearly identify CO2 emission sources in a way that policy-makers can utilize and the public can understand.“Cities have had little information with which to guide reductions in greenhouse gas emissions – and you can’t reduce what you can’t measure,” said Kevin Gurney, an associate professor in ASU’s School of Life Sciences, and senior scientist with the Global Institute of Sustainability. “With Hestia, we can provide cities with a complete, three-dimensional picture of where, when and how carbon dioxide emissions are occurring.”

Pingback: Visualizing Carbon | Raxa Collective