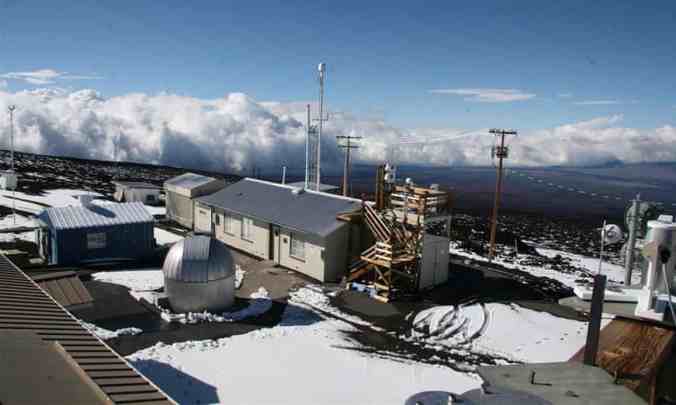
The Mauna Loa weather observatory in Hawaii. The Guardian will publish the Mauna Loa carbon count every day. Photograph: Courtesy of NOAA
Our thanks to the Guardian for this reminder of our shared responsibility:
Why the Guardian is putting global CO2 levels in the weather forecast
As CO2levels climb, the carbon count is a daily reminder we must tackle climate change now
The simplest measure of how the mass burning of fossil fuels is disrupting the stable climate in which human civilisation developed is the number of carbon dioxide molecules in the atmosphere.
Today, the CO2 level is the highest it has been for several million years. Back then, temperatures were 3-4C hotter, sea level was 15-20 metres higher and trees grew at the south pole. Worse, billions of tonnes of carbon pollution continues to pour into the air every year and at a rate 10 times faster than for 66m years.
At the dawn of the industrial revolution, CO2 was at 280 parts per million (ppm) in the atmosphere. By 1958, when the first measurements were made at Mauna Loa in Hawaii, it had reached 315ppm. It raced past 350ppm in 1986 and 400ppm in 2013.
The Guardian will now publish the Mauna Loa carbon count, the global benchmark, on the weather page of the paper every day.
“When I read the letter from Guardian reader Daniel Scharf encouraging us to include information on climate change in our weather forecasts, we thought it was a fantastic idea,” said the Guardian’s editor-in-chief, Katharine Viner.
“Levels of carbon dioxide in the atmosphere have risen so dramatically, and including a measure of that in our daily weather report is symbolic of what human activity is doing to our climate. People need reminding that the climate crisis is no longer a future problem – we need to tackle it now, and every day matters.”
While weather changes daily, climate changes over years and decades. So alongside the daily carbon count, we will publish the level in previous years for comparison, as well as the pre-industrial baseline of 280ppm, and the level seen as manageable in the long term of 350ppm.
Year-on-year comparisons are important because each year there is a natural rise and fall of CO2 levels, rather like the planet breathing. Trees and plants absorb carbon and release oxygen as they grow, lowering atmospheric CO2.
As most plants are in the northern hemisphere, CO2 reaches its lowest level each year at the end of the growing season in October. Then it begins to rise as dying plants decay, reaching a peak in May or June.
While the CO2 level is an important and symbolic measure of the global warming caused by humanity, it is a simple one. The increases in temperature the world experiences, and the heatwaves, storms and droughts that strike, also depend on how fast emissions rise or fall and how long they remain at high levels. The 350ppm level was proposed in 2008 by Nasa’s Prof James Hansen as a suitable target.
