Visualize Pi Noise

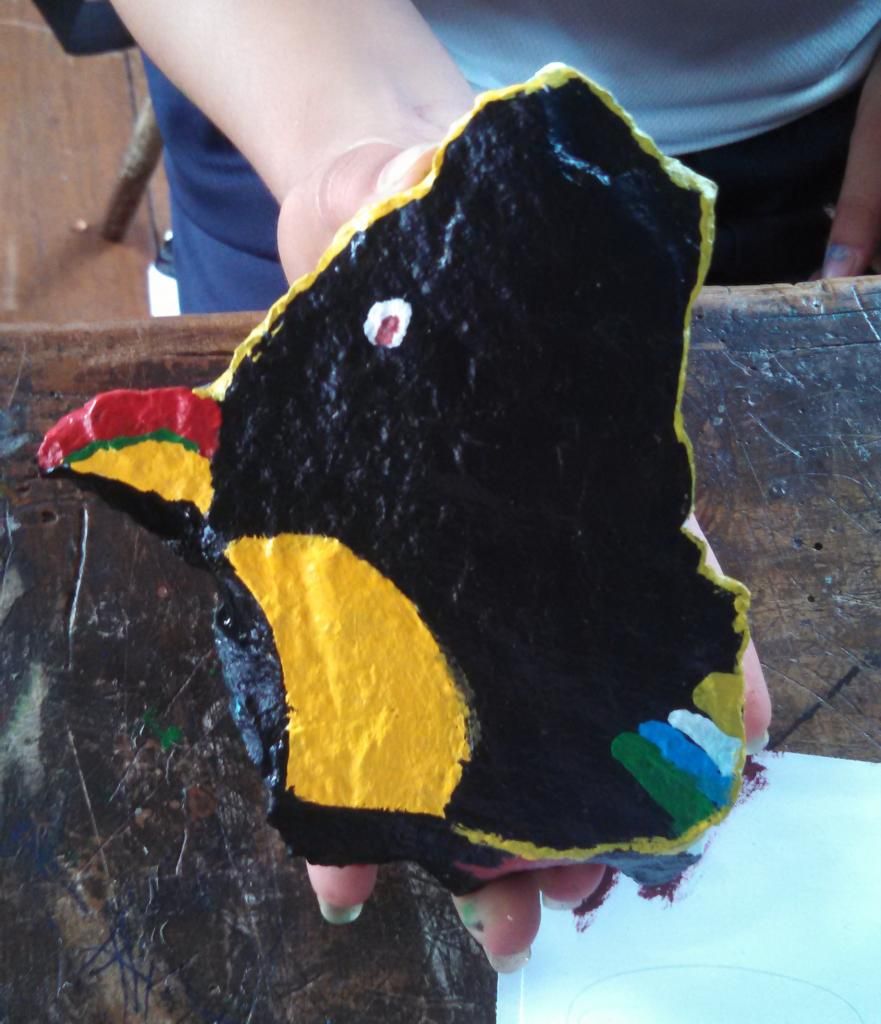
Histogram of Emotions

Weather Mural

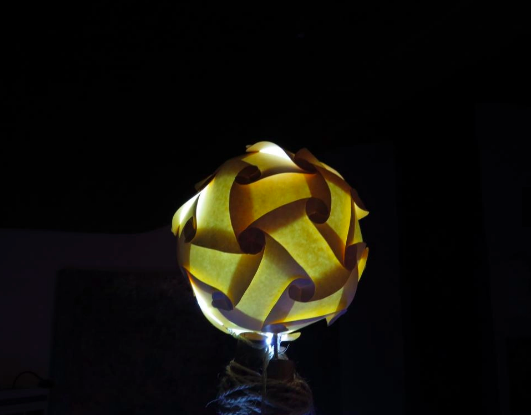
Visualize Pi with Golden Spiral
Both a transcendental and an irrational number, Pi (π) is the ratio of a circle’s circumference to its diameter. And both in definition and actuality it epitomizes coolness, inspiring musical homages, from rap to fugue. Albert Einstein, master of the time-space continuum, was born on this day. Makes sense, right?
But what about visual inspiration?
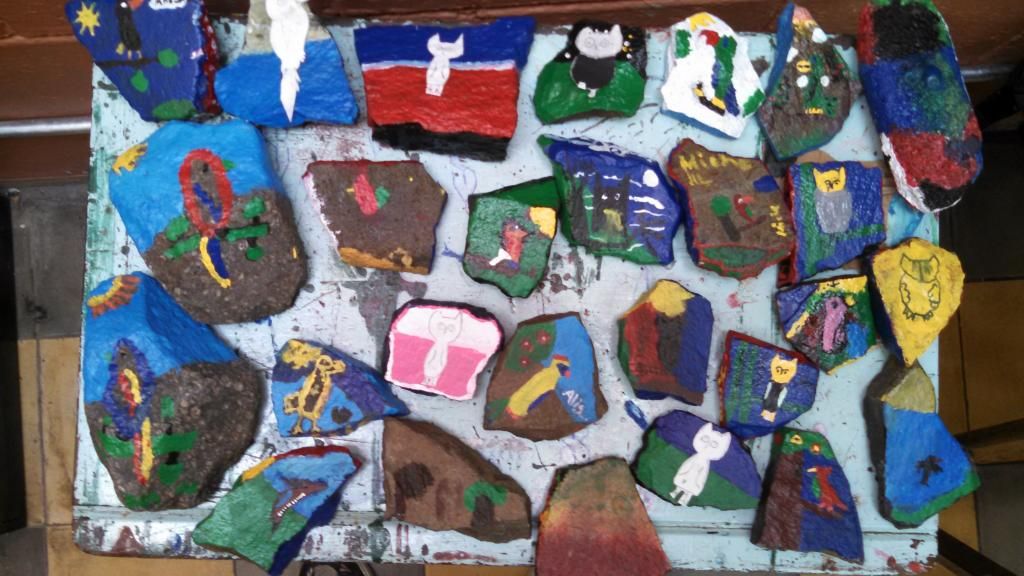
Artist Ellie Balk collaborates with students from The Green School in East Williamsburg, Brooklyn to combine mathematics and art to VISUALIZE Pi as murals in their community.
Starting in 2011 the artist/student/educator teams graphed Pi in colorful, creative and innovative ways: a histogram of emotions; a weather mural, a reflective line graph that resembles a sound wave and the relationship between the golden ratio and Pi.
For example:
In 2012, students constructed an image of the golden spiral based on the Fibonacci Sequence and began to explore the relationship between the golden ratio and Pi. The number Pi was represented in a color-coded graph within the golden spiral. In this, the numbers are seen as color blocks that vary in size proportionately within the shrinking space of the spiral, allowing us to visualize the shape of Pi and its negative space to look for “patterns”. The students soon realized that the irrational number of Pi created no patterns at all, resulting in a space that resembles “noise”.
In response to that, in 2013 students worked to visualize the number Pi as a reflective line graph that resembles a sound wave. The colors of the mural change at each prime number in Pi so that the viewer can visualize a pattern of prime numbers within Pi. Located on a busy corner in East Williamsburg, Brooklyn, the sounds of the bustling traffic and rhythmic commuter passing creates the perfect backdrop for our visualization. Continue reading →

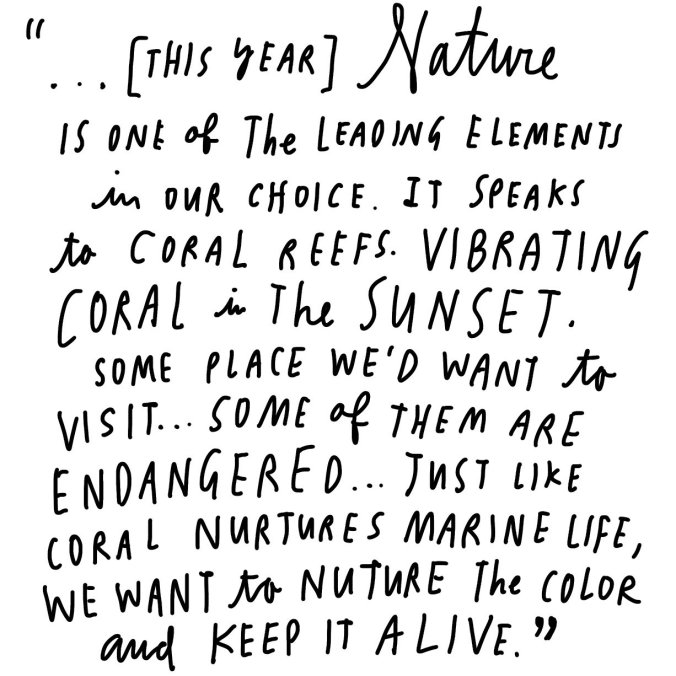
 Click the image above or to the left to go to the graphic narrative published in the New York Times by Wendy McNaughton, whose website is a treasure chest of visual wit and explanatory power.