Thanks to The Morning News, and Rosecrans Baldwin in particular, for bringing this book out of the specialty section and to our attention:
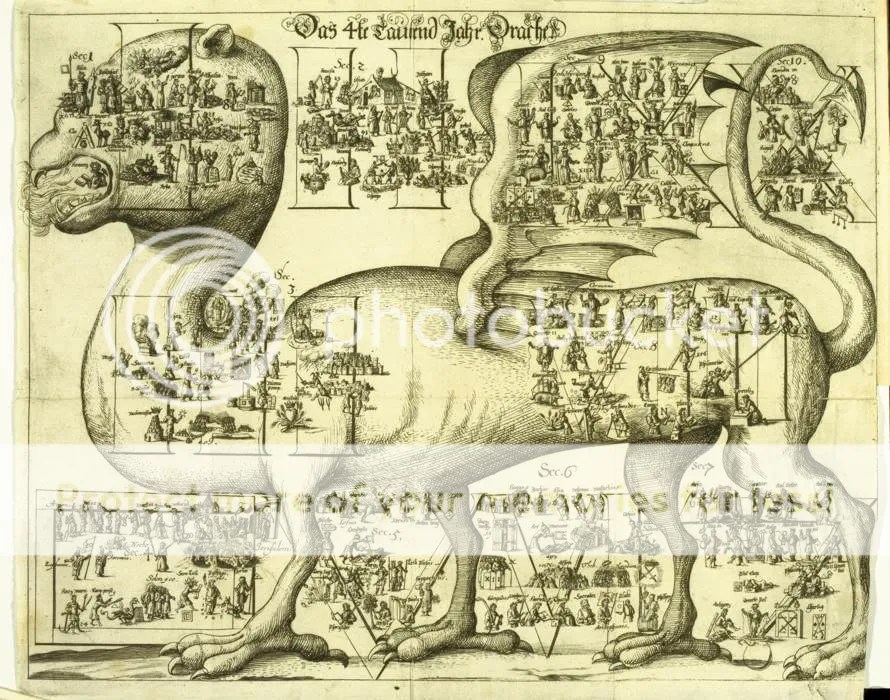
Selections from a captivating history of timelines—from time circles to time dragons, to a history of the world drawn on a single piece of paper.
Reviewed here in detail, the motivating paragraph on why you might want to seek this out the next time you are in a library on a university campus, to kill an hour browsing in the stacks:
Throughout the Renaissance, chronology and geography constituted the “two eyes of history.” But geography had gained the upper hand by the eighteenth century and, with the demotion of the ancients from unsurpassable sages to quasi-barbarians, the purpose of chronology shifted from Biblical exegesis to charting human progress. Technological changes toward the beginning of the century allowed for the compression of timelines into much smaller formats. By the century’s second half, the “problem of regularization and measurement” stood as the primary challenge (112). For Rosenberg and Grafton, the most significant development in this period – and perhaps in the entire history of modern chronography – was the advent of Joseph Priestley’s colorful charts of the 1760s. These “masterpieces of visual economy” introduced an ingenious new harmonization of “historical time and measured graphic space” (126). They demonstrated how the basic principles for the representation of geographic space could be employed, with elegant clarity, to give visual expression to events over time. Priestley’s innovations opened the door to the kinds of graphs we are familiar with today by inspiring later designers – most notably William Playfair – to refine these forms and extend them to the representation of data in general.

fascinating and fun!
Agreed! Thanks for stopping by and come back soon!